> ## Documentation Index
> Fetch the complete documentation index at: https://axiom-mano-support-improvements.mintlify.site/llms.txt
> Use this file to discover all available pages before exploring further.
# Table
> This section explains how to create table dashboard elements and add them to your dashboard.
export const elementName_0 = "table"
export const elementButtonLabel_0 = "Table"
The table dashboard element displays a summary of any attributes from your metrics, logs, or traces in a sortable table format. Each row in the table could represent a different service, host, or other entity, with columns showing various attributes or metrics for that entity.
Column resizing is not supported in the table dashboard element. To resize columns, use the **Query** tab, switch to the column-per-field view, and drag the column borders to resize them. For more information, see [Query data](/query-data/explore#select-displayed-fields).
## Prerequisites
* [Create an Axiom account](https://app.axiom.co/register).
* [Create a dataset in Axiom](/reference/datasets) where you send your data.
* [Send data](/send-data/methods) to your Axiom dataset.
* [Create an empty dashboard](/dashboards/create).
## Create {elementName_0}
1. Go to the Dashboards tab and open the dashboard to which you want to add the {elementName_0}.
2. Click **Add element** in the top right corner.
3. Click **{elementButtonLabel_0}** from the list.
4. Choose one of the following:
* Click **Builder** to create your chart using a visual query builder. For more information, see [Create chart using visual query builder](/dashboard-elements/create#create-chart-using-visual-query-builder).
* Click **APL** to create your chart using the Axiom Processing Language (APL). Create a chart in the same way you create a chart in the APL query builder of the [Query tab](/query-data/explore#create-a-query-using-apl).
5. Optional: [Configure the dashboard element](/dashboard-elements/configure).
6. Click **Save**.
The new element appears in your dashboard. At the bottom, click **Save** to save your changes to the dashboard.
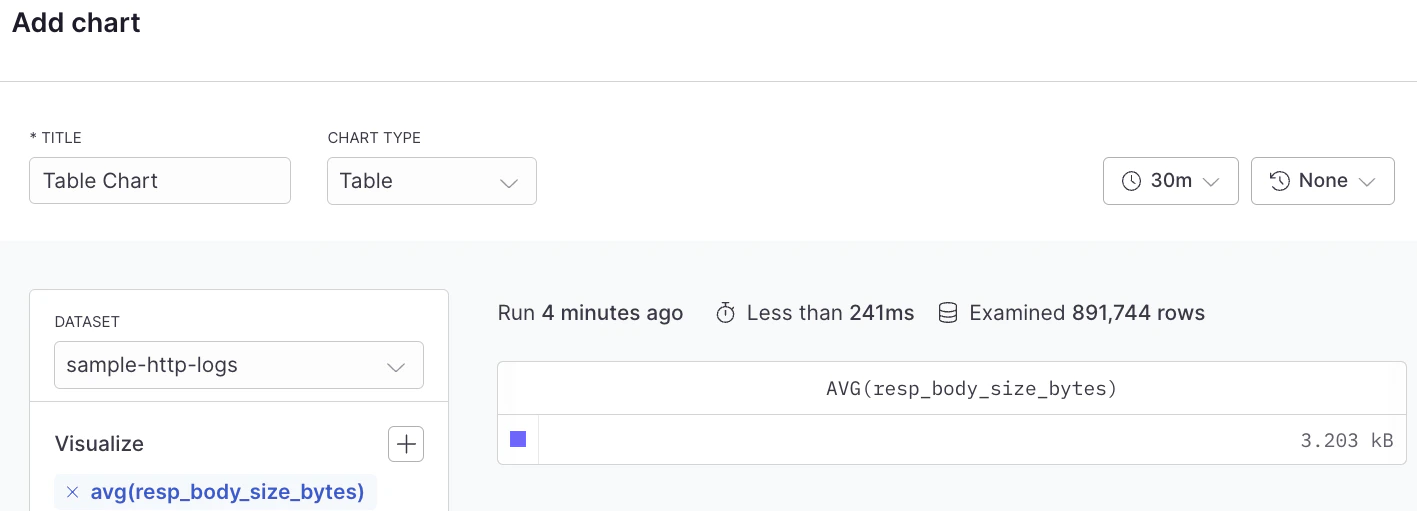
## Example with Builder
 ## Example with APL
```kusto theme={null}
['sample-http-logs']
| summarize avg(resp_body_size_bytes) by bin_auto(_time)
```
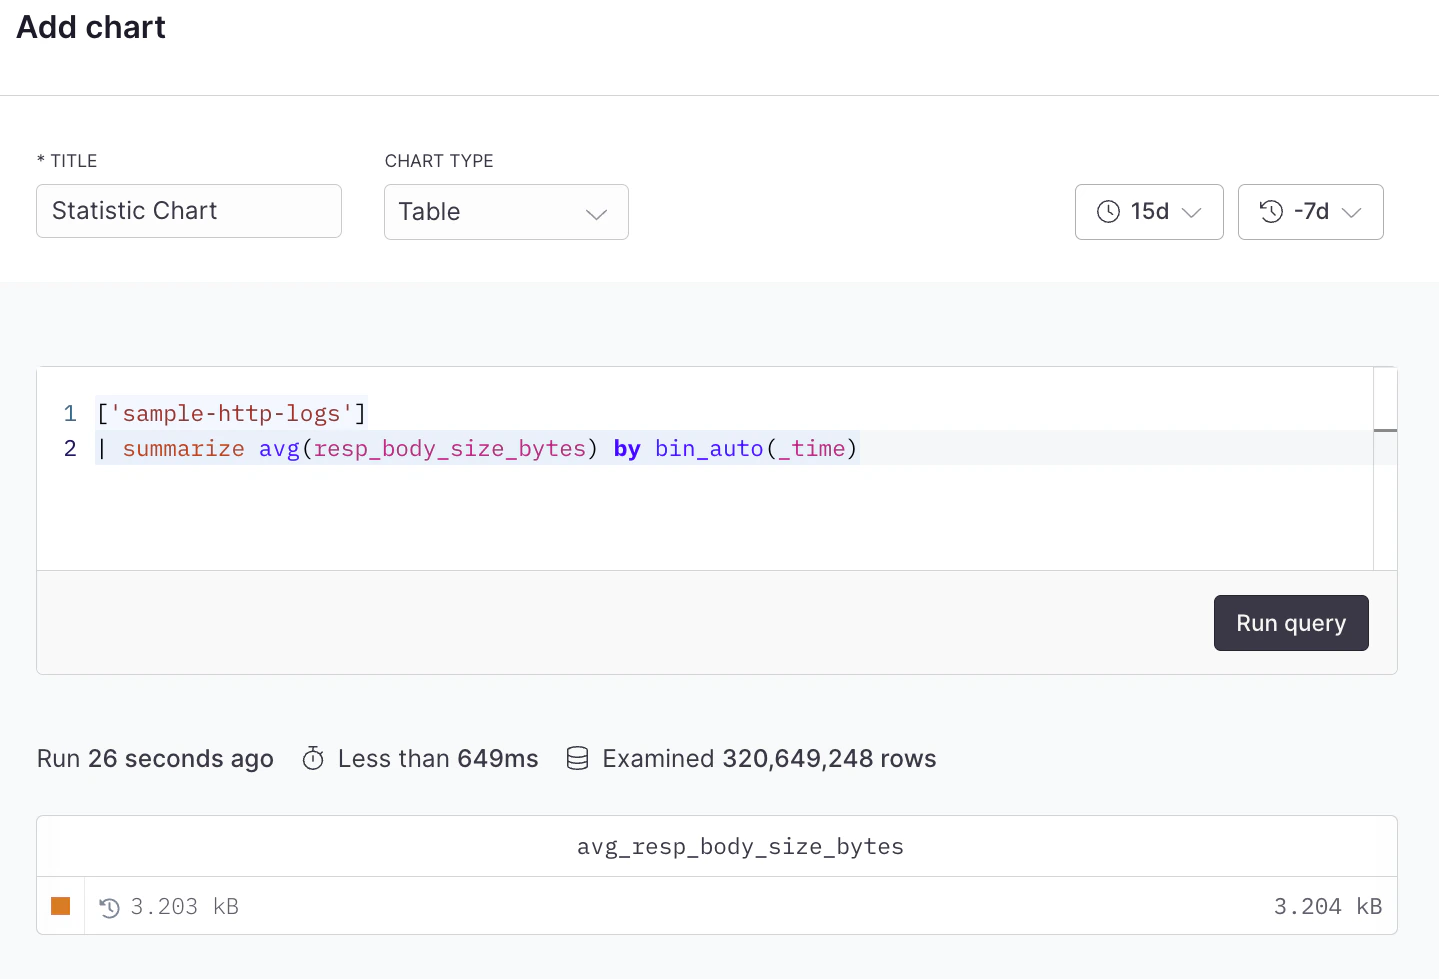
## Example with APL
```kusto theme={null}
['sample-http-logs']
| summarize avg(resp_body_size_bytes) by bin_auto(_time)
```
 ## Combine multiple queries in a table
Each table element uses a single query. To display data from multiple queries in one table, use the [`union`](/apl/tabular-operators/union-operator) operator in your APL query to combine results from multiple datasets or queries.
For example, to combine HTTP logs and security logs in a single table:
```kusto theme={null}
['sample-http-logs']
| union ['security-logs']
| summarize count() by status, bin_auto(_time)
```
You can also combine multiple queries with different structures. The `union` operator merges compatible fields and preserves all rows from both queries:
```kusto theme={null}
['web-server-logs']
| project _time, status, method, uri
| union ['api-server-logs']
| project _time, status, method, endpoint
| order by _time desc
```
If you need to display data from multiple independent queries that can't be combined with `union`, create separate table elements in your dashboard instead.
## Combine multiple queries in a table
Each table element uses a single query. To display data from multiple queries in one table, use the [`union`](/apl/tabular-operators/union-operator) operator in your APL query to combine results from multiple datasets or queries.
For example, to combine HTTP logs and security logs in a single table:
```kusto theme={null}
['sample-http-logs']
| union ['security-logs']
| summarize count() by status, bin_auto(_time)
```
You can also combine multiple queries with different structures. The `union` operator merges compatible fields and preserves all rows from both queries:
```kusto theme={null}
['web-server-logs']
| project _time, status, method, uri
| union ['api-server-logs']
| project _time, status, method, endpoint
| order by _time desc
```
If you need to display data from multiple independent queries that can't be combined with `union`, create separate table elements in your dashboard instead.